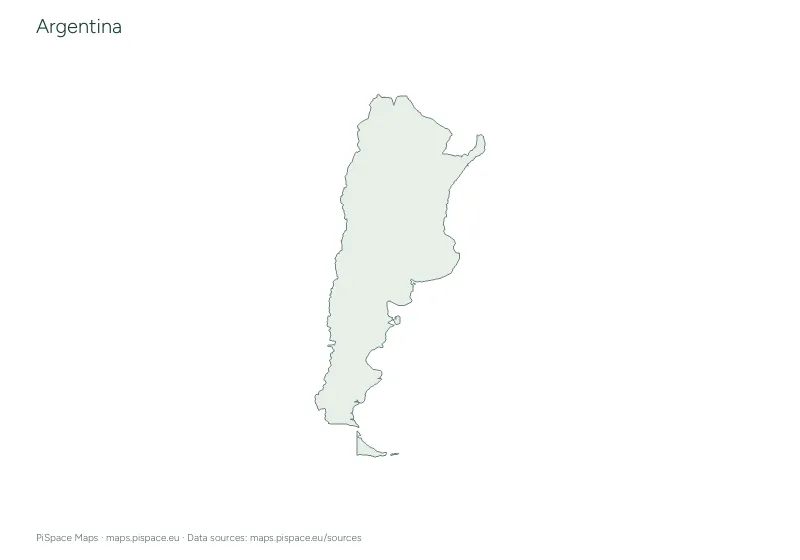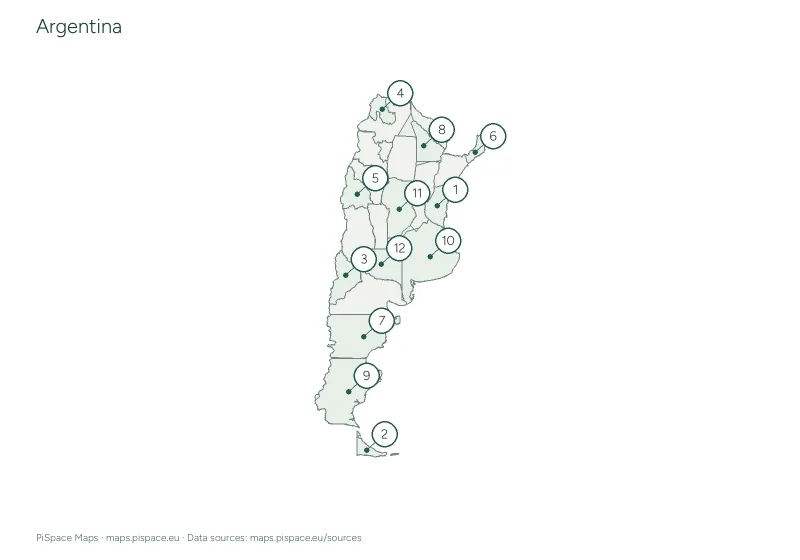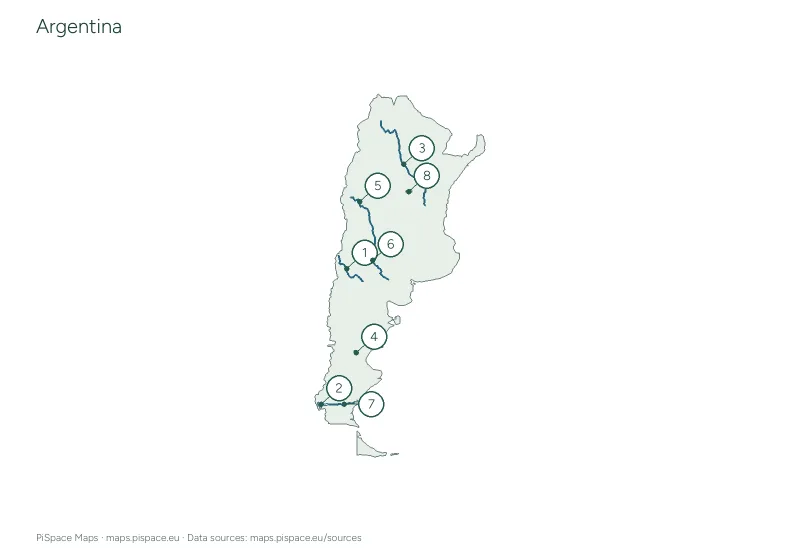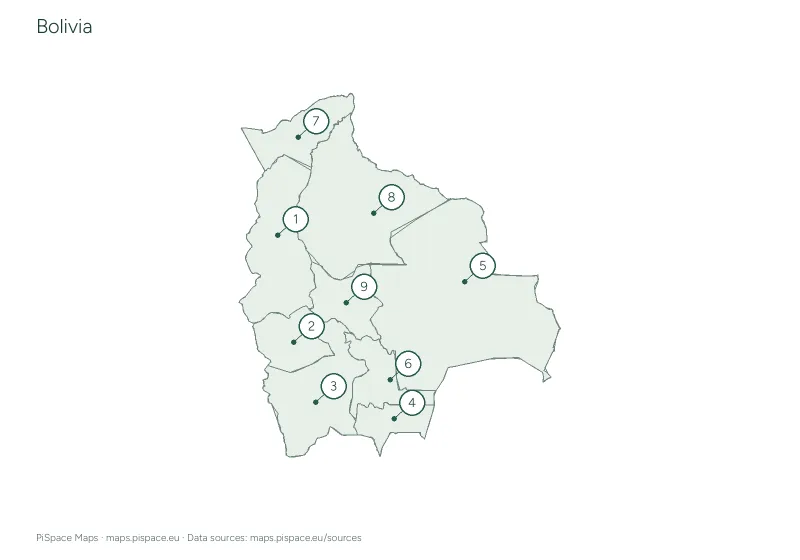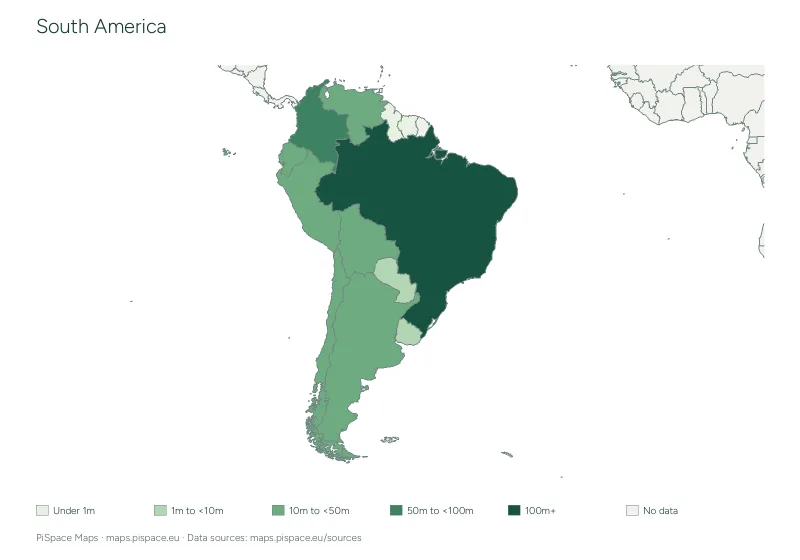
South America population map and data table
Compare latest available World Bank country population totals on a shaded map, with dated reference tables.
- Difficulty
- Intermediate
- PDF pages
- 2
Download this resource
Choose the paper size and version that work for your lesson.
A4 · Colour2-page PDF with source credits and the reference material shown on this page.A4 · Ink-saving2-page PDF with source credits and the reference material shown on this page.US Letter · Colour2-page PDF with source credits and the reference material shown on this page.US Letter · Ink-saving2-page PDF with source credits and the reference material shown on this page.
For printing, select the paper size shown on your download. Check the print preview before making classroom copies. Printing guide
Using this activity
- Read the population band legend on the map. Grey means no matched World Bank observation.
- Use the reference table to compare exact values and observation years. These are country totals, not density or city populations.
- Observation years may differ. Geographic and statistical territory coverage can differ between Natural Earth and World Bank.
What to practise
- Read a choropleth map using a key.
- Compare population totals while checking each observation year.
Reference data
| Country or territory | Population | Observation year |
|---|---|---|
| Argentina | 45,851,378 | 2025 |
| Bolivia | 12,581,843 | 2025 |
| Brazil | 212,812,405 | 2025 |
| Chile | 19,859,921 | 2025 |
| Colombia | 53,425,635 | 2025 |
| Ecuador | 18,289,896 | 2025 |
| Guyana | 835,986 | 2025 |
| Paraguay | 7,013,078 | 2025 |
| Peru | 34,576,665 | 2025 |
| Suriname | 639,850 | 2025 |
| Uruguay | 3,384,688 | 2025 |
| Venezuela | 28,516,896 | 2025 |
Map data: World Bank and Natural Earth. Snapshot retrieved 2026-10-22 01:24:56 UTC. Latest available observations: 2025. Boundaries are simplified for printing. Sources and licences